Styling changes presentation, not the underlying geometry or attributes.
Style changes presentation, not the data
Open Style & labels in the Data/GIS window when the goal is to communicate a layer more clearly without changing its geometry or attributes. Style configuration is part of the project presentation model; Processing scope and geometry validity are separate concerns.
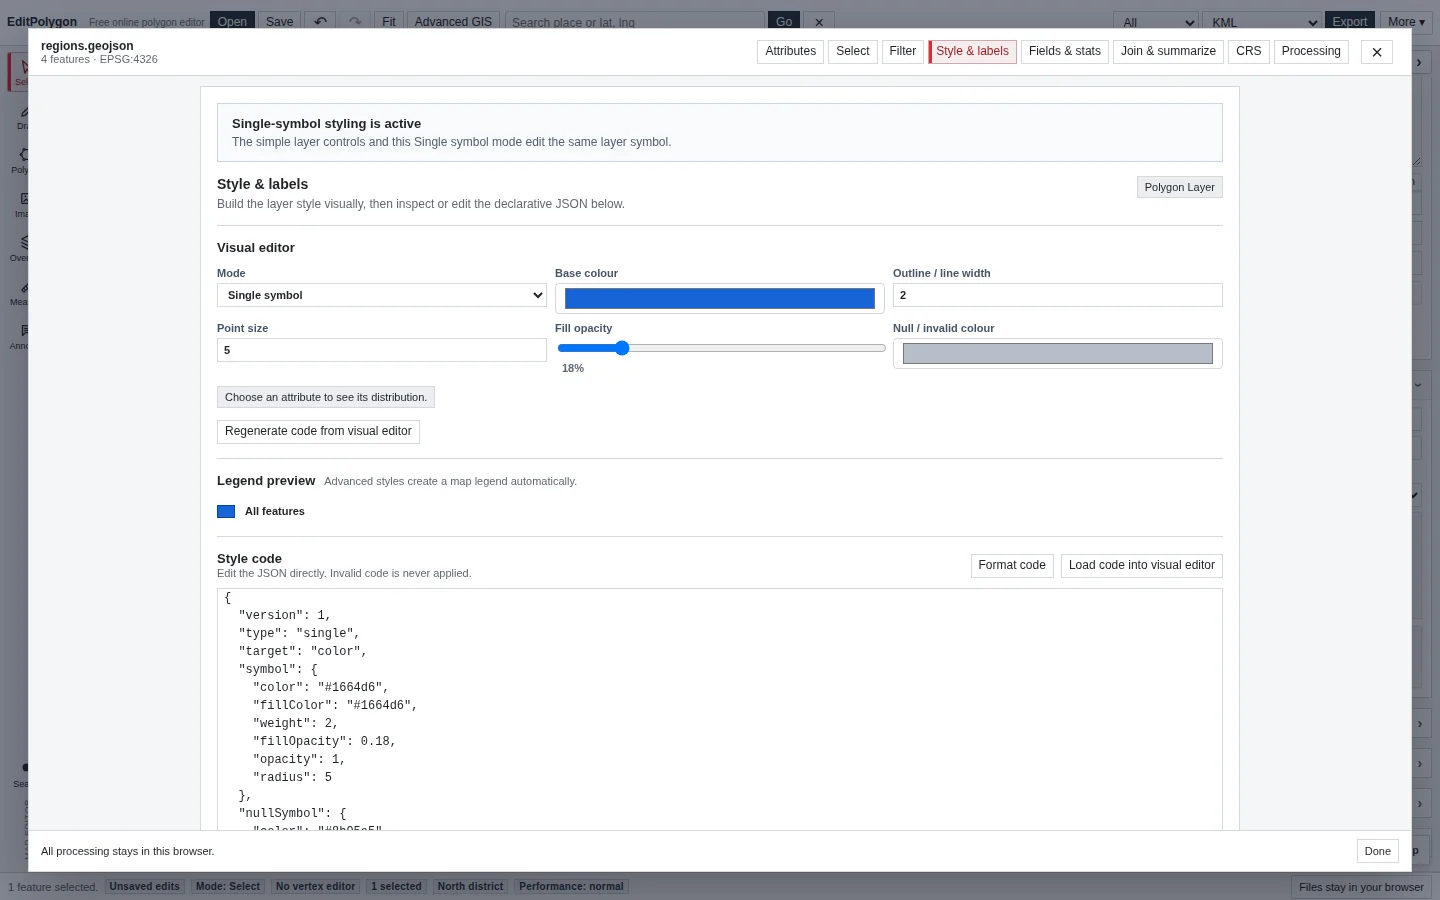
Single-symbol styling
Single applies one symbol to the layer. Depending on geometry family, the symbol model includes colour/fill, line weight, opacity and point radius controls as appropriate.
Use a single symbol when categories or numeric values are not part of the visual message, or when a contextual layer should remain visually quiet behind the layer you are analysing.
Categorized styling
Categorized assigns symbols from a field's distinct values. It is suitable for nominal data such as region, status, warning type or ownership class.
EditPolygon builds categories from the field values and tracks null/missing values separately. Very high-cardinality fields are usually poor choices for category styling because the resulting legend becomes difficult to interpret.
Graduated numeric classes
Graduated divides numeric values into classes. The current style engine supports equal-interval, quantile and manual class boundaries, with a configurable number of classes.
Graduated styles can drive colour and, for compatible geometry, visual size/weight targets. Choose breaks based on the meaning of the data rather than accepting a classification method mechanically.
Divides the numeric range into equal-sized intervals. Useful when absolute differences matter and the distribution is not severely skewed.
Puts roughly similar numbers of records into each class. Useful for rank-style comparison, but class widths may vary substantially.
Uses boundaries you provide. Prefer this when operational thresholds or published categories already exist.
Remain distinct from numeric classes so missing data is not silently portrayed as a valid low or high value.
Continuous styling
Continuous maps a numeric field continuously across a visual ramp instead of dividing it into discrete classes. Use it when a gradual change is meaningful and a class boundary would imply a distinction that does not really exist.
The style engine includes reusable colour ramps such as Blues, Greens, Heat, Viridis, Blue–red and Purple. Colour should still be chosen for the audience and map context rather than because a palette is available.
Colour, point radius and line weight
Data-driven styling can target different visual variables where they make sense:
- Colour for points, lines or polygon fill/stroke.
- Radius for point magnitude.
- Weight for line or outline emphasis.
A visual variable should match the data. For example, point radius can communicate magnitude, while colour categories are usually clearer for unordered classes.
Configure labels
The same tab manages map labels for an editable layer. Choose the attribute that should appear as the feature label and configure the available label presentation controls for the current layer.
Labels are a display property. Changing the label field does not rename records or change the underlying attribute value.
A map can become unreadable when every record is labelled at once. Filter, simplify the presentation or hide contextual layers when the label density overwhelms the map.
Preview and inspect at the intended map scale
A style that looks clear at statewide scale may be unusable at neighbourhood scale, and vice versa. Inspect the map at the scale where the output will actually be used.
If a numeric style looks wrong, check the underlying field statistics first. Unexpected nulls, strings in a numeric field or extreme outliers can explain a misleading classification more reliably than changing colours repeatedly.
Styling and Processing outputs
Processing tools have a style policy. Some derived outputs inherit appropriate presentation from their source; others use a derived symbol suited to the output geometry. Processing does not use layer styling to decide which features are members of an operation.
After creating a derived layer, reopen Style & labels if the output needs a purpose-specific cartographic treatment.
- The chosen style type matches the attribute's meaning.
- Numeric fields were checked for nulls, invalid values and outliers before classification.
- Manual thresholds are used when operational categories already exist.
- Labels identify the intended field and remain readable at the target scale.
- Styling is not being mistaken for filtering or Processing scope.
Common questions
Does changing a layer style change its GIS geometry?
No. Styling and labels change presentation only; the underlying feature geometry and attribute values are not rewritten by the style.
Can labels use feature attributes?
Yes. Label configuration can use layer fields so map text follows the attributes stored on each feature.